We know you value expert insights on gold investments, which is why we’re excited to share the World Gold Council’s recently released Mid-Year Outlook for 2023. This report is a treasure trove of data and analysis on the gold market.
Here’s a short list of some of their findings:
Between A Soft And A Hard place
As developed economies approach the tail end of their monetary tightening cycles, the market is bracing for a potential slowdown. While current consensus suggests a modest contraction in the U.S. by late 2023 and sluggish growth in other developed markets, investors remain cautious. The delayed impact of monetary policy on economic performance leaves room for the possibility of a more severe downturn, commonly referred to as a “hard landing.”
Gold’s Resilient Performance
In the first six months of 2023, gold’s value rose by 5.4%, ending June at a price of $1,912.25 per ounce (Chart 1). This robust performance outpaced nearly all other major asset classes, with the exception of stocks in developed markets.
Not only did gold yield positive returns, but it also acted as a stabilizing force, particularly during the mini-banking crisis that occurred in March.
Several key factors contributed to gold’s resilience:
- A stable U.S. dollar and steady interest rates
- Effective hedging against event-based risks
- Sustained demand from central banks
Figure 1: There Is Potential Upside For Gold In 2023, But Risks Persist
Gold’s indicative performance based on various hypothetical scenarios*

*See Figure 2 for a detailed review of the macroeconomic and financial conditions of each scenario. Analysis based on WGC’s Gold Valuation Framework. For equivalent scenarios based on Oxford Economics data, visit Qaurum.
Chart 1: Gold Has Been A Top Performing Asset In 2023
YTD return in USD of major assets*
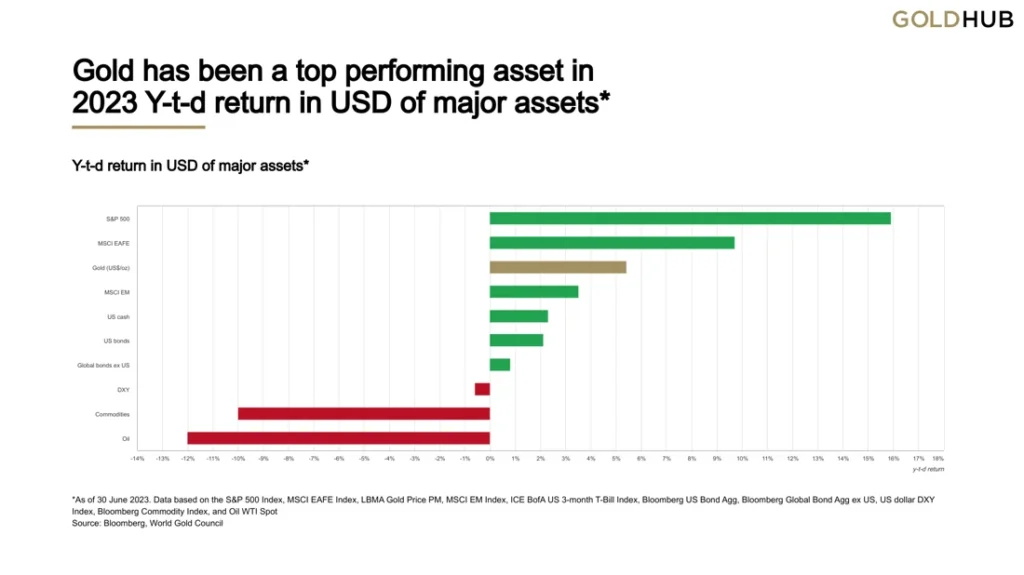
*As of 30 June 2023. Data based on the S&P 500 Index, MSCI EAFE Index, LBMA Gold Price PM, MSCI EM Index, ICE BofA US 3-month T-Bill Index, Bloomberg US Bond Agg, Bloomberg Global Bond Agg ex US, US dollar DXY Index, Bloomberg Commodity Index, and Oil WTI Spot.
Monetary Tightening Nearing Its End
Both the European Central Bank (ECB) and the Bank of England (BoE) raised interest rates in June. In contrast, the U.S. Federal Reserve maintained its rates, allowing the economy to absorb the effects of previous hikes. Market participants expect one more rate hike from the Fed this year, likely in July, before a prolonged pause. Similarly, although the ECB and BoE may further raise rates, the market believes the tightening cycle will conclude by year’s end.
As the focus shifts from monetary tightening to a holding pattern, the market predicts a mild economic contraction in the U.S. and sluggish growth in other developed nations. Under this scenario, gold is expected to maintain its strong performance from the first half of the year, although significant price jumps are unlikely.
Key Drivers Of Gold’s Performance
Gold’s stability is influenced by four main factors (Figure 2):
- Economic expansion
- Risk levels
- Opportunity cost
- Market momentum
With tight monetary policies in place, investors are closely watching the Institute for Supply Management (ISM) Purchasing Manager’s Indexes (PMIs) for signs of economic weakening. Recent data indicates a decline in both manufacturing and services PMIs in developed markets.
Figure 2: Detailed Macroeconomic Scenarios For H2 2023
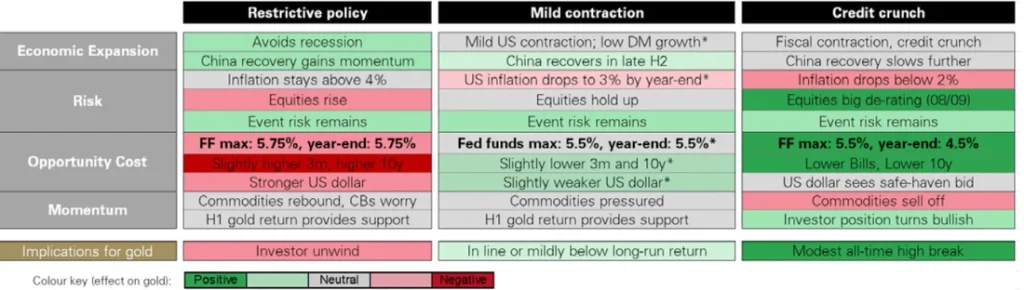
*Corresponds to Bloomberg consensus as of 30 June 2023. Fed funds (FF) refers to the upper bound Fed funds target rate. DM stands for developed markets. Gold implications based on Gold Valuation Framework. Equivalent hypothetical scenarios also available at Qaurum.
Chart 2: Gold Has Had A Positive Average Return In Periods When The Fed Is On Hold
Gold monthly returns during Fed on-hold periods*
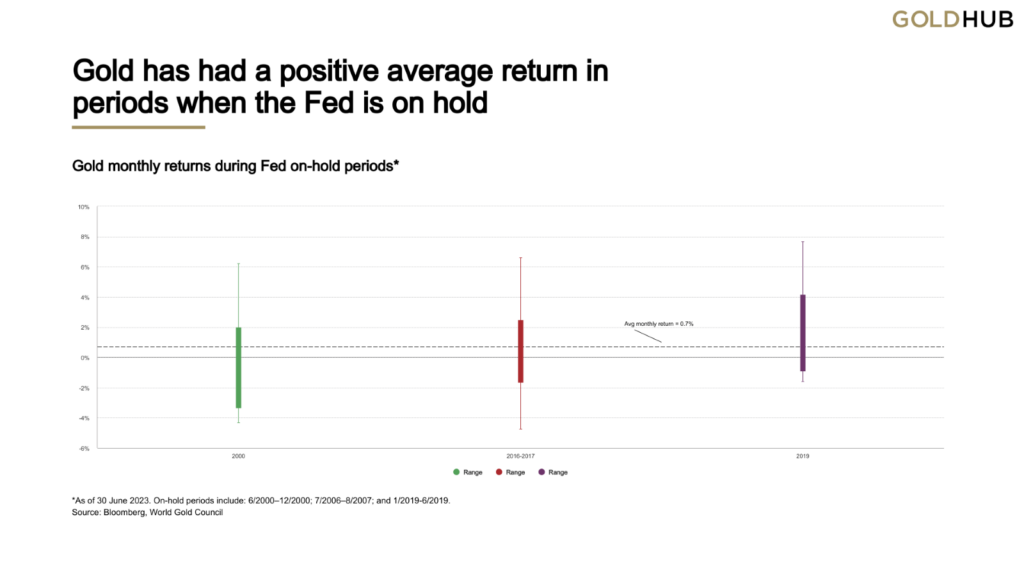
*As of 30 June 2023. On hold periods include: 6/2000–12/2000; 7/2006–8/2007; and 1/2019-6/2019.
Our analysis shows that gold tends to outperform equities when manufacturing PMI is below 50 and falling (Chart 3). Further, if PMI falls below 45, history suggests gold’s outperformance may be even more pronounced. And while gold has underperformed against equities if manufacturing PMI is below 50 but rising, it has still delivered positive returns, showcasing the asymmetrical benefits it tends to bring to portfolios.
Chart 3: Gold Outperforms Stocks In Periods When PMI Declines But Still Captures The Upside If It Rises
3-month forward returns for gold and stocks when ISM manufacturing PMI is below 50*
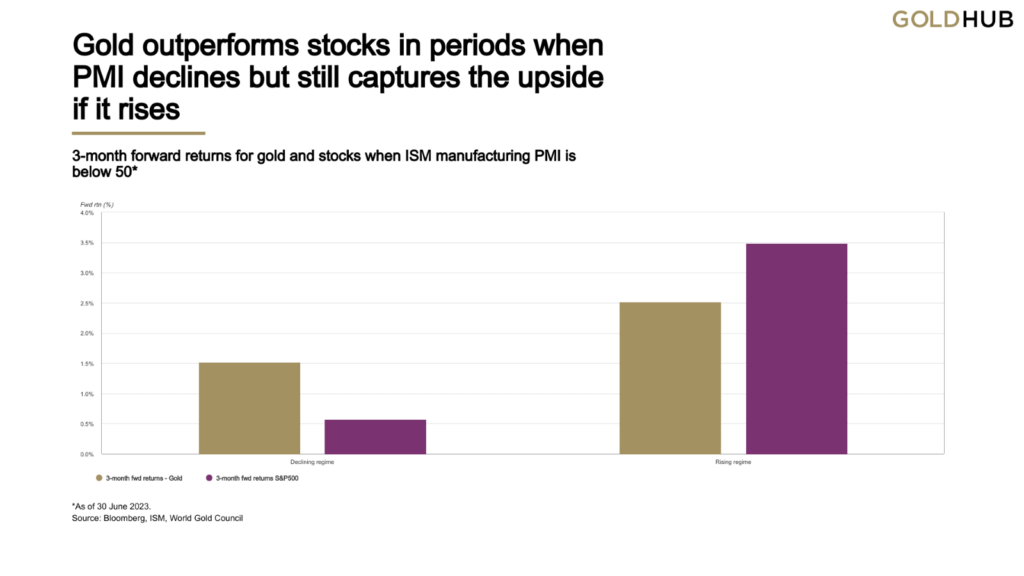
*As of 30 June 2023.
Upside With Risks
If the risk of recession grows, gold could become an even more attractive investment. Historically, such periods have resulted in higher volatility, significant stock market pullbacks, and an overall appetite for high quality, liquid assets such as gold (Chart 4).
Chart 4: Gold Has Historically Performed Well During Recessionary Periods
Gold and the USD during recessions*

*As of 30 June 2023. Based on LBMA Gold Price PM and US dollar DXY Index.
If the economy manages a soft landing—avoiding a recession while maintaining tight monetary policy—gold could face challenges, potentially leading to disinvestment. However, considering gold’s strong performance in the first half of the year, a significant investor pullback would be required to bring the average 2023 gold price below its 2022 average of $1,800 per ounce.
Asymmetrical Benefits
As investors assess the impact of restrictive monetary policy and the possibility of a recession, they often dial up defensive strategies in their asset allocation. To illustrate this, we compare two hypothetical defensive strategies. One where 20% of the equity allocation is invested in defensive sectors, and one where 10% is invested in defensive sectors and 10% in gold (Table 1).
Our analysis shows that, over the past 25 years, the strategy including gold would have improved returns, while reducing volatility and drawdown.
Table 1: Gold May Help Improve Defensive Strategies
Comparison of hypothetical investment strategies*
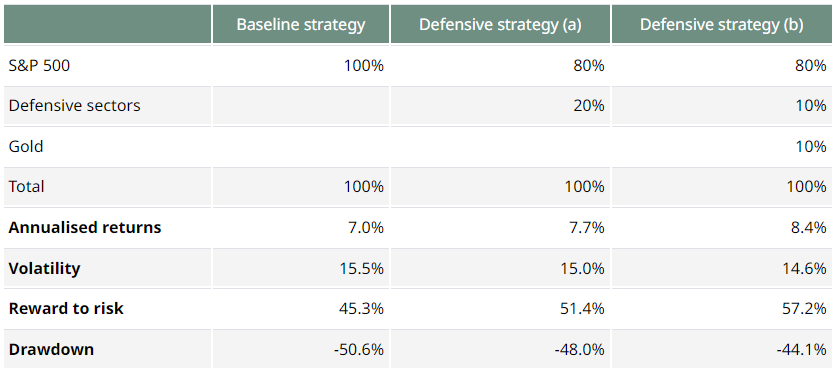
*Based on data from December 1998 (due to data availability) to May 2023. Defensive sectors include Consumer Staples, Energy, Healthcare, Telecom, and Utilities. Hypothetical strategy invests in defensive strategy at the peak and disinvests at the trough.
In Conclusion…
If the U.S. economy experiences the anticipated mild contraction, gold’s strong performance in the first half of the year is likely to stabilize in the second half. In such a scenario, a weaker U.S. dollar and steady bond yields would support gold prices, although this could be offset by declining inflation rates. Historically, periods of stable monetary policy have correlated with above-average monthly returns for gold.
A more volatile economic downturn would create a favorable environment for gold, driving up its value due to increased market uncertainty and risk aversion.
On the other hand, if monetary tightening persists longer than anticipated, or if the economy manages a soft landing, gold could face headwinds. This would likely lead to disinvestment in gold, as investors turn to riskier assets and a stronger U.S. dollar.
Given the unpredictable nature of global economic conditions, gold’s ability to perform well in various scenarios makes it a valuable addition to any investment portfolio.
***Note*** This is a summary of the World Gold Council’s Mid-Year Gold Report. For the complete report, visit their website.
If you’re considering expanding your precious metals portfolio, Hard Assets Alliance is here to simplify the process for you. We’ve made buying gold bullion as easy as possible.
Thank you for being a valued Hard Assets Alliance customer. Your trust in our services is greatly appreciated.
Best regards,
The Hard Assets Alliance Team